| Exam Name: | Google Professional Data Engineer Exam | ||
| Exam Code: | Professional-Data-Engineer Dumps | ||
| Vendor: | Certification: | Google Cloud Certified | |
| Questions: | 400 Q&A's | Shared By: | thiago |
You are designing the database schema for a machine learning-based food ordering service that will predict what users want to eat. Here is some of the information you need to store:
The user profile: What the user likes and doesn’t like to eat
The user account information: Name, address, preferred meal times
The order information: When orders are made, from where, to whom
The database will be used to store all the transactional data of the product. You want to optimize the data schema. Which Google Cloud Platform product should you use?
You are choosing a NoSQL database to handle telemetry data submitted from millions of Internet-of-Things (IoT) devices. The volume of data is growing at 100 TB per year, and each data entry has about 100 attributes. The data processing pipeline does not require atomicity, consistency, isolation, and durability (ACID). However, high availability and low latency are required.
You need to analyze the data by querying against individual fields. Which three databases meet your requirements? (Choose three.)
You work for an economic consulting firm that helps companies identify economic trends as they happen. As part of your analysis, you use Google BigQuery to correlate customer data with the average prices of the 100 most common goods sold, including bread, gasoline, milk, and others. The average prices of these goods are updated every 30 minutes. You want to make sure this data stays up to date so you can combine it with other data in BigQuery as cheaply as possible. What should you do?
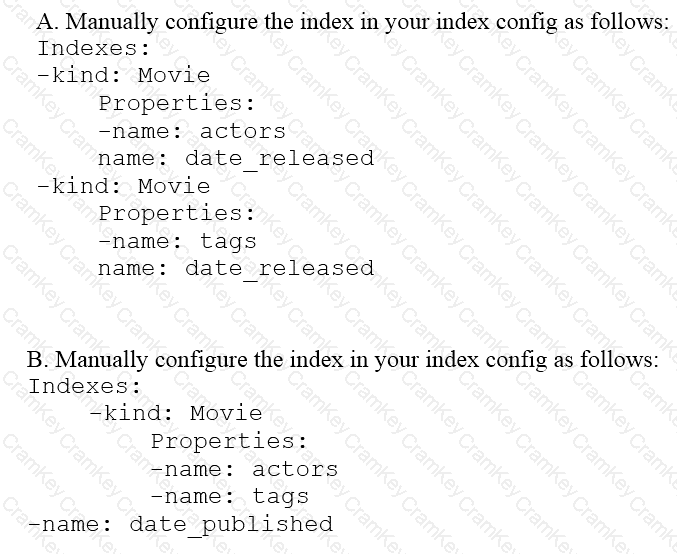
You are deploying a new storage system for your mobile application, which is a media streaming service. You decide the best fit is Google Cloud Datastore. You have entities with multiple properties, some of which can take on multiple values. For example, in the entity ‘Movie’ the property ‘actors’ and the property ‘tags’ have multiple values but the property ‘date released’ does not. A typical query would ask for all movies with actor=

TESTED 02 Aug 2026